Maps Page on Country/Region
Outline
- Physical Environment
- Climates of Mexico
- Agriculture of South Africa
- Climates of Canada
- Weather & Climate
- Weather of US
- Climate of Africa
- Earthquakes of Japan
- Human Environment
- Literacy rates of India
- Population Density of China
- Income of UK
- Road maps
- Road map of Nebraska
- Road map of Germany
- Road Map of Japan
- City Maps
- NYC map
- LA map
- Washington D.C. map
- Urban Transportation Maps
- Washington D.C. transportation map
- NYC transportation map
- LA transportation map
- Tourist Maps
- Nebraska tourist map
- Ireland tourist map
- San Francisco tourist map
1 Physical Environment
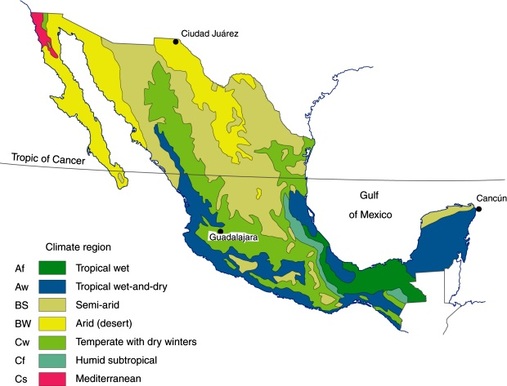
The climates of Mexico map covers the climates of Mexico. The climates are broken up into seven categories. Tropical wet is represented as green, while tropical wet and dry regions are blue. Semi-air is a tan color, and arid desert climates are yellow. Temperate areas with dry winters are green. Humid zones are teal. Mediterranean regions are shown as pink spots. The only Mediterranean spot on this map is up by California. The further south you go in Mexico the more it becomes a tropical wet and dry climate. A semi-arid climate dominates the middle of Mexico. Northern Mexico is covered in desert. There are some humid subtropical regions on the gulf side of Mexico. This kind of map is helpful in identifying climates.Link: https://twillismexico.weebly.com/physical-geography-and-environment.html.
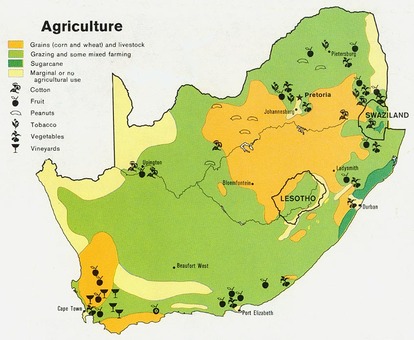
The agriculture of South Africa map covers the agriculture of South Africa. Grains like corn and wheat zones are orange. Grazing and farmland areas are colored light green. Sugar can development is colored dark green. Spots of little or no agriculture are tan. Cotton, fruit, peanuts, tobacco, veggies, and wine production are all indicated on the map. The southern coast of South Africa is home to a lot of fruit and wine production. The core of South Africa is home to a lot of Peanuts, vegetables, and cotton production. Sugarcane is made on the east coast of South Africa. This map is helpful for understanding what can be grown where. Link: http://ahawmansouthafrica.weebly.com/physical-geography-and-environment.html.
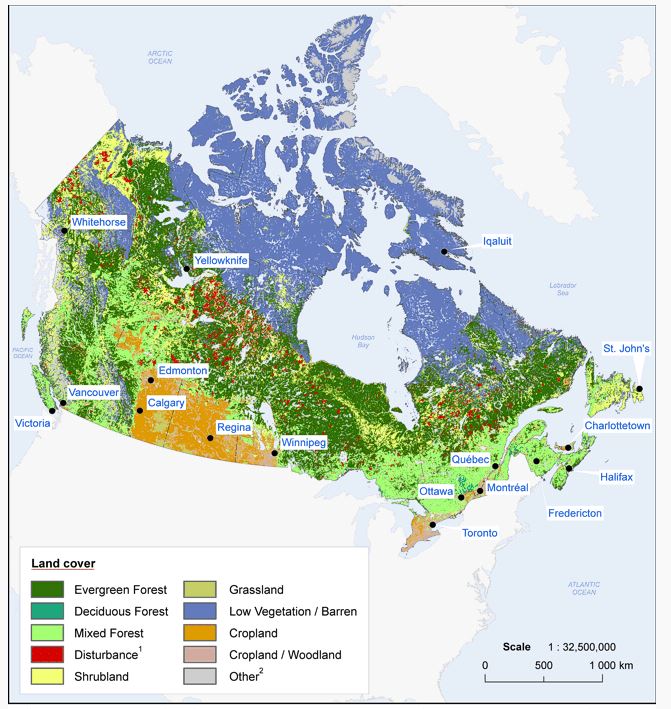
The climate of Canada map covers the climate of Canada. This climate map covers the type of land found in Canada. The map is divided into 10 categories. Five of the categories are types of forest like evergreen, deciduous, mixed, shrub, and lumber. The other five categories are types of grasslands like low vegetation, cropland, woodland, other, and grassland. Much of Canadas farmland is along the border with the US. Evergreen forest makes up the majority of Canada. Mixed forest make duo a lot of the area around Quebec and Toronto. Barren land or low vegetation dominates northern Canada. This kind of map is helpful for understanding where the people might be. Link:https://www150.statcan.gc.ca/n1/pub/16-201-x/2007000/5212638-eng.htm.
2 Weather & Climate
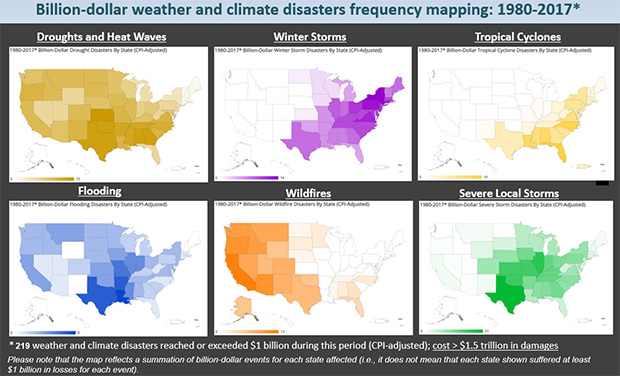
The maps on weather in the US were interesting to me. The maps show the impact of major weather events in regions of the US. The areas depicted in these maps are the west, south, Midwest, and east coast. Some weather also harms the whole country. Heat waves are the weather event that causes damage to the whole country. Winter storms mostly occur on the east coast. Hurricanes occur the most a lot the east coast. Severe local storms happen in the south frequently. Wildfires happen the most on the west coast. Flooding harms the Midwest the most. This kind of map is helpful for finding a good place to live. Link: https://www.climate.gov/news-features/blogs/beyond-data/2017-us-billion-dollar-weather-and-climate-disasters-historic-year.
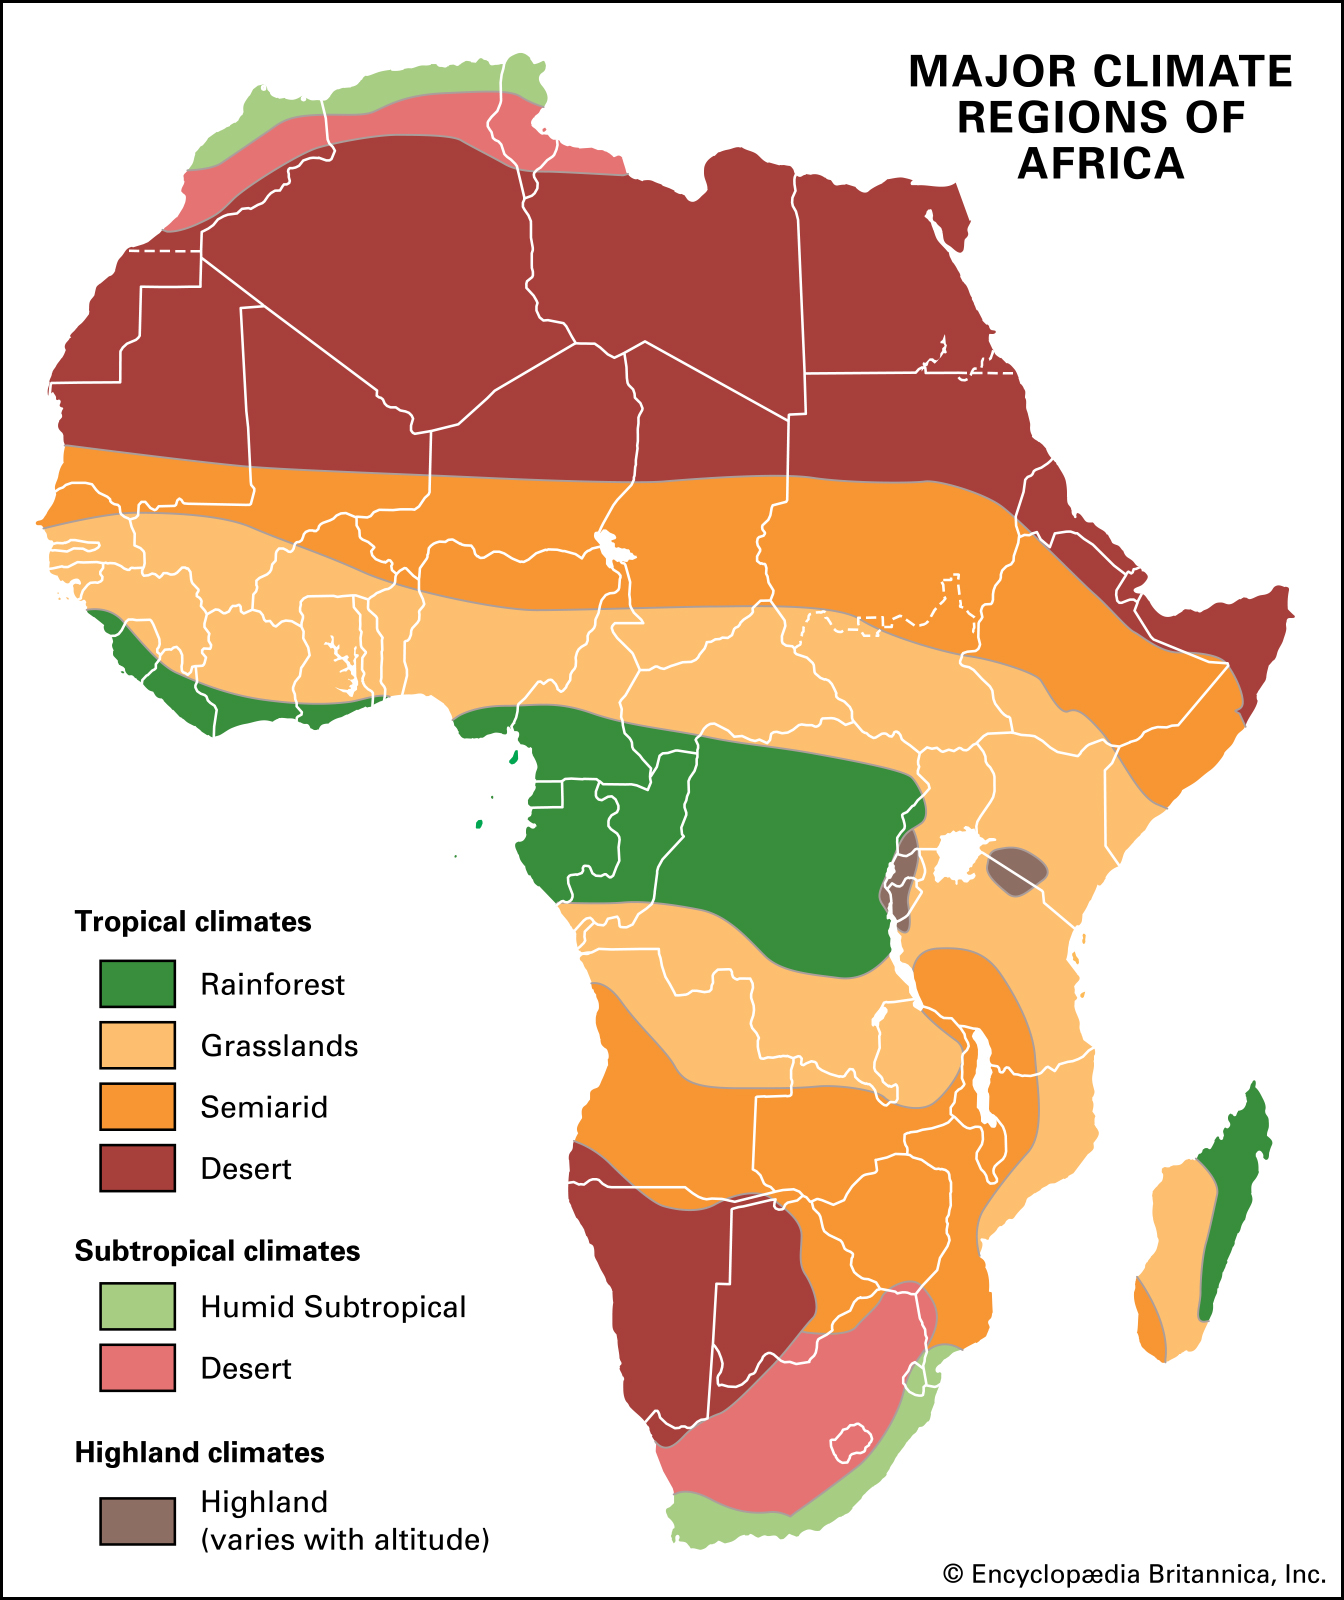
The climates of Africa map details the climates of Africa. The map has seven categories. Rainforest in dark green, while humid subtropical is light green. Grasslands are tan, and semi-arid regions are orange. Tropical deserts are red, while subtropical deserts are pink. Highland is displayed as brown. Northern Africa is a tropical desert. Below the Sahara it becomes semi-arid, then transforming into grasslands. Rainforests are located around Congo. Down towards South Africa it becomes a mix of topical desert, subtropical desert, and humid subtropical. This kind of map is helpful in knowing what areas to avoid. Link: https://www.britannica.com/place/Africa/Climate.
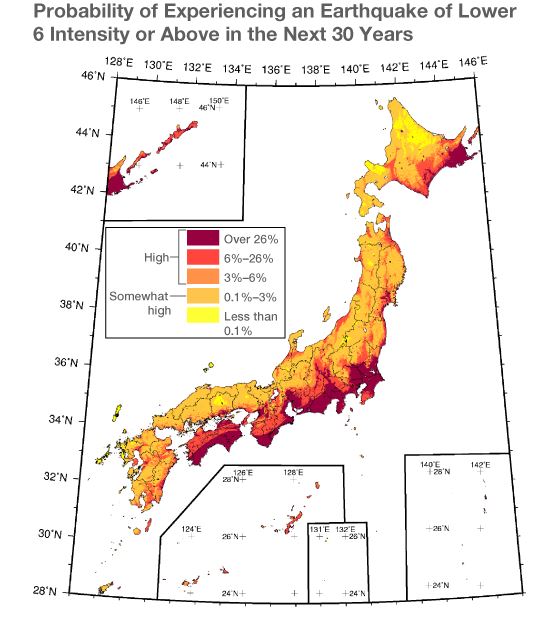
The earthquake map of Japan covers the probability of 6 or higher earthquake happening in the next 30 years in Japan. High areas are dark red. Low areas are represented as yellow. The entire east coast of Japan is at extremely high risk of a 6 or higher earthquake. The west coast of Japan is at around a three to six percent risk of a 6 or higher earthquake. This kind of map clarifies where to live. Link: https://www.nippon.com/en/features/h00234/the-next-big-one-government-map-forecasts-likely-future-japanese-earthquakes.html.
3 Human Environment
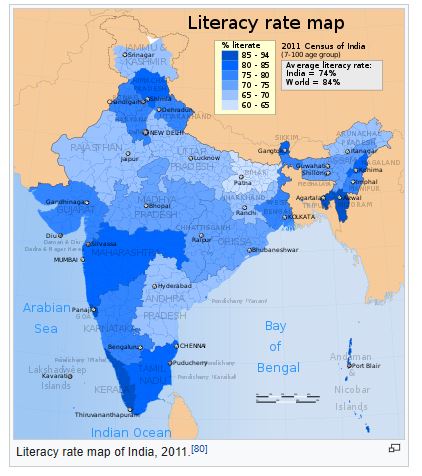
The literacy map of India goes over the literacy rate in India. The areas of high literacy are represented as dark blue. The areas of low literacy are shown as light blue. The southern coast of India has the most amount of literate people in India. The core of India has medium and low areas of literacy in India. The bigger cities are located on the coast, bigger cities off more opportunity to become literate. The core of India might have a lower literacy rate as it is more rural. This kind of map is important in understanding the education of a region. Link: https://en.wikipedia.org/wiki/Demographics_of_India.
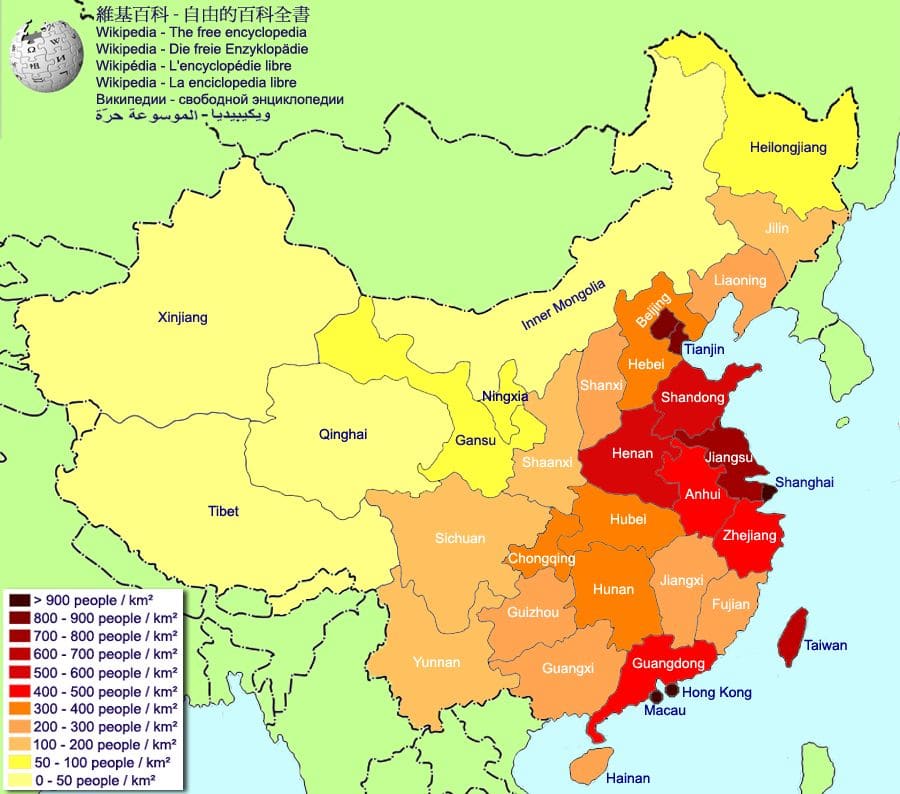
The population density map of China goes over the areas and regions of China with the greatest amount of people in an area. The areas of high population density are represented as red. The areas of low population density are represented as yellow. Along the east coast of China, the population density is very high. The coast of China offers giant cities. The interior of China is mostly desert, mountains, and rural land. The western region of China has a much lower population density than the coast. This kind of map is important in understanding why so many people may live where they do. Link: https://www.china-mike.com/china-travel-tips/tourist-maps/china-population-maps/.
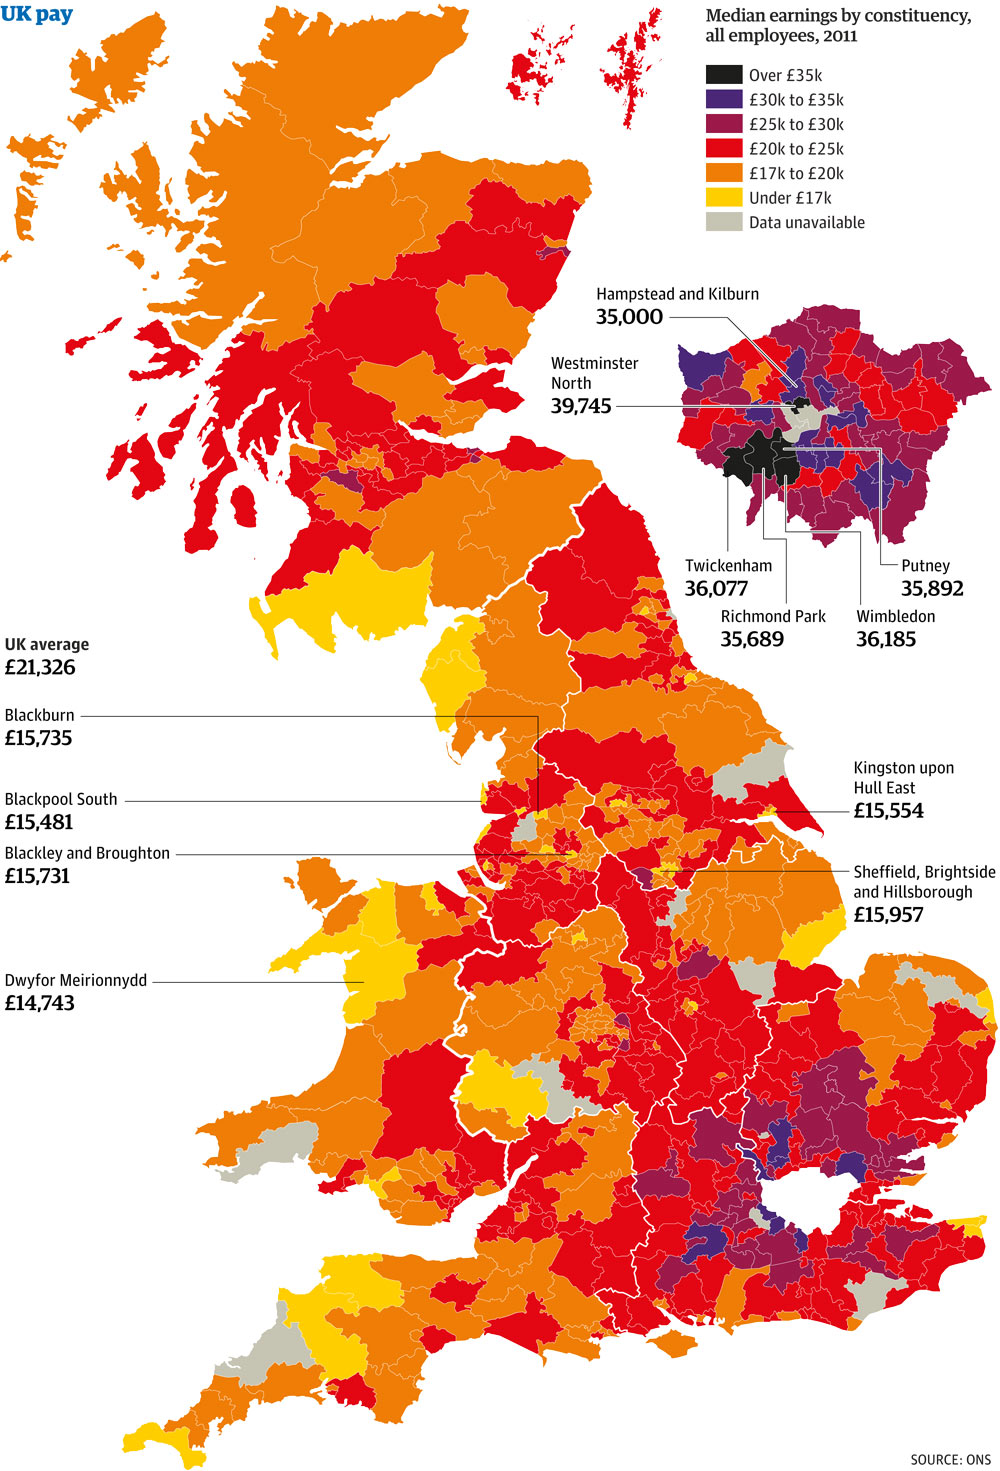
The income of the UK map goes over the distribution of wealth in the UK. This map is broken up into seven categories. Black spots are over 35k euros. Purple spots are over 30k euros. Dark red represents 25k euros. Red shows those who make 20k euros. Orange is for those who make 17k euros. Yellow is the lowest category and shows those who make under 17k euros. Then grey is unavailable data. The southern region of the UK has very high totals of income. The north and western region of the UK have lower total of income. Areas around Wimbledon and Westminster have some of the highest incomes in the country. This kind of map clarifies the income of areas. Link: https://www.theguardian.com/news/datablog/2011/nov/24/wages-britain-ashe-mapped.
4 Road Maps
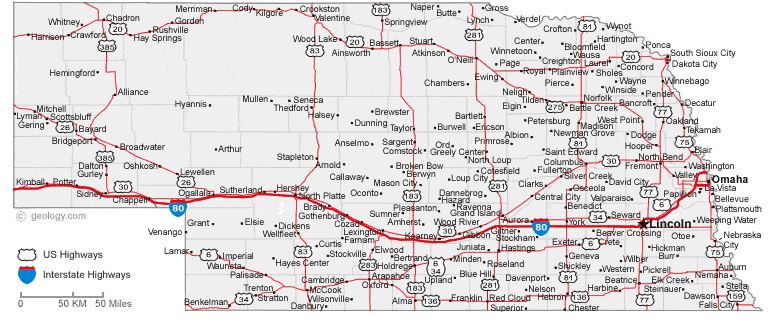
The road map of Nebraska displays the major roads of Nebraska. I80 is a giant red beam across the state. Smaller but important roads are displayed as well. The interstate is a dark red thick bold line. Highways are a thin red line. Major cities are bolded. Smaller cities are in a smaller font. This kind of map is helpful in getting around. Link: https://geology.com/cities-map/nebraska.shtml.
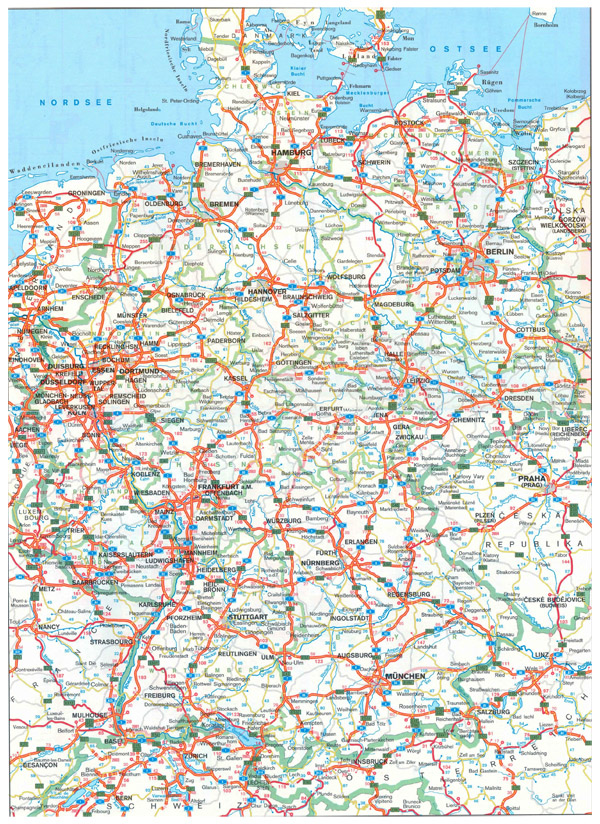
The road map of Germany shows the major roads of Germany. Europe is a lot smaller than the US. Travelling times are much smaller in Europe than the US. There are so many roads on this map Major roads are a thick bold red line and smaller roads are a faint yellow line. Major cities are bolded and smaller cities are in a smaller font. This map is in German possibly making it harder for travelers. Link: http://www.vidiani.com/large-detailed-road-map-of-germany-with-all-cities/.
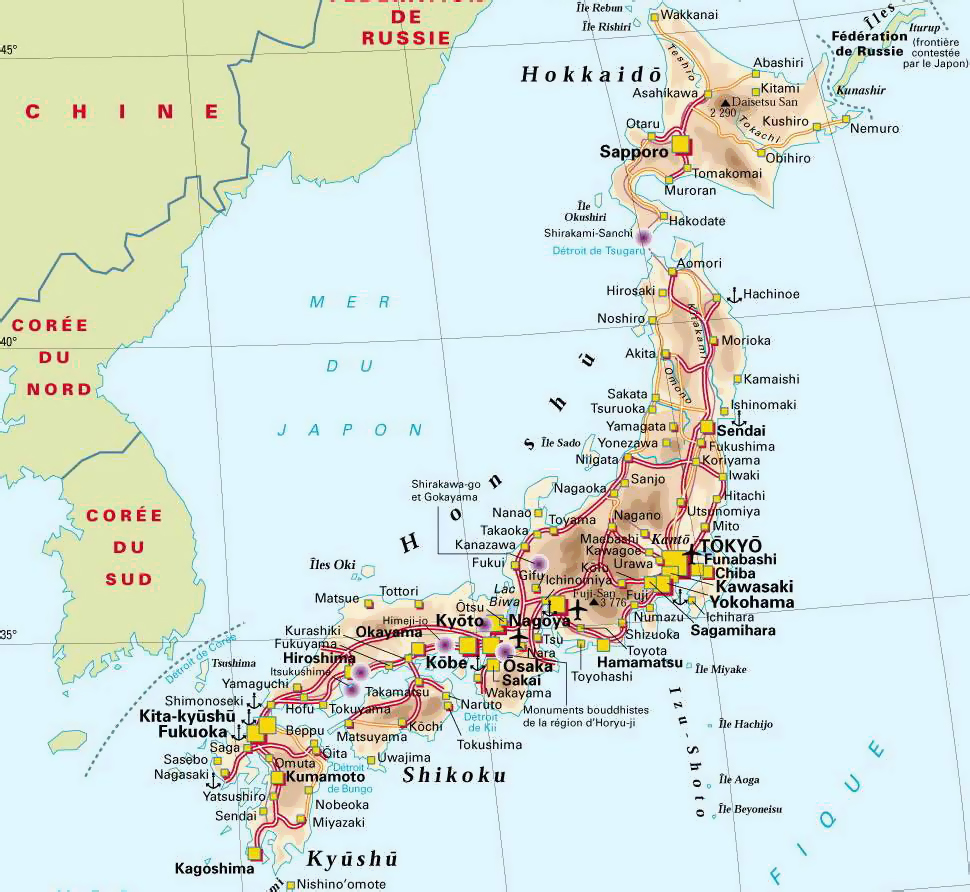
The road map of Japan displays the major roads of Japan. Major roads are shown as a white and red line. There are a lot few roads in Japan than Germany. Smaller roads are a smaller yellow and white line. Major cities are bold, while smaller cities are in a smaller font. This kind of map is helpful in knowing where you are. Link: http://www.maps-of-the-world.net/maps-of-asia/maps-of-japan/.
5 City Maps
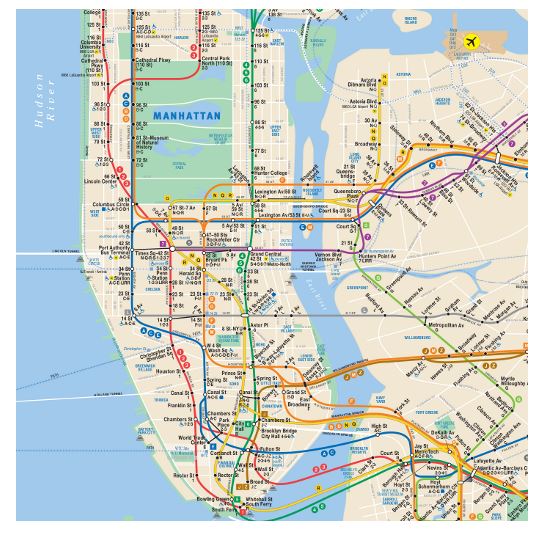
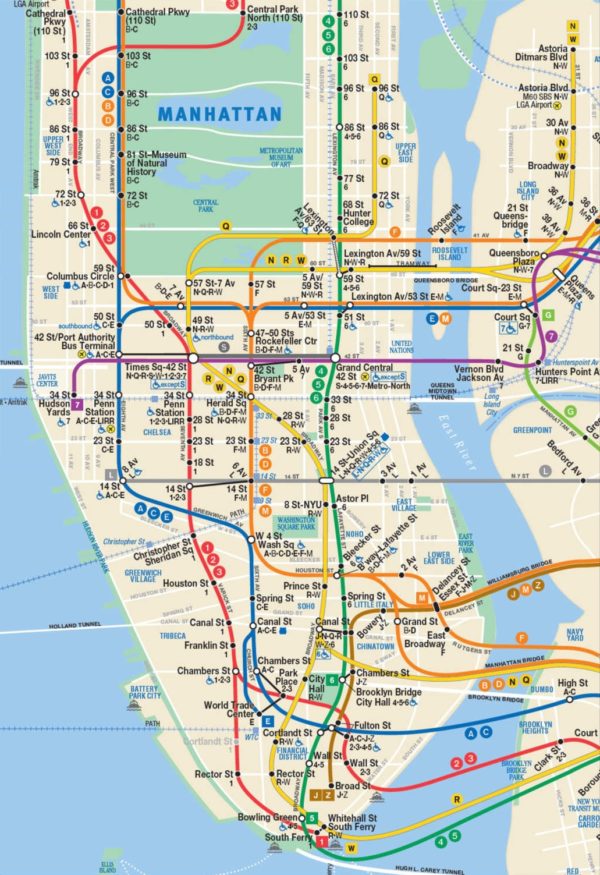
The city map of NYC displays the layout of Manhattan. The map shows roads and water sources, but also the subway and bus routes. The map shows state parks. The airport is located on this map. This map is helpful for having a up close idea on an area. Link: https://www.amazon.com/ApperEph-Subway-Map-NYC/dp/B013Y4FLC0.
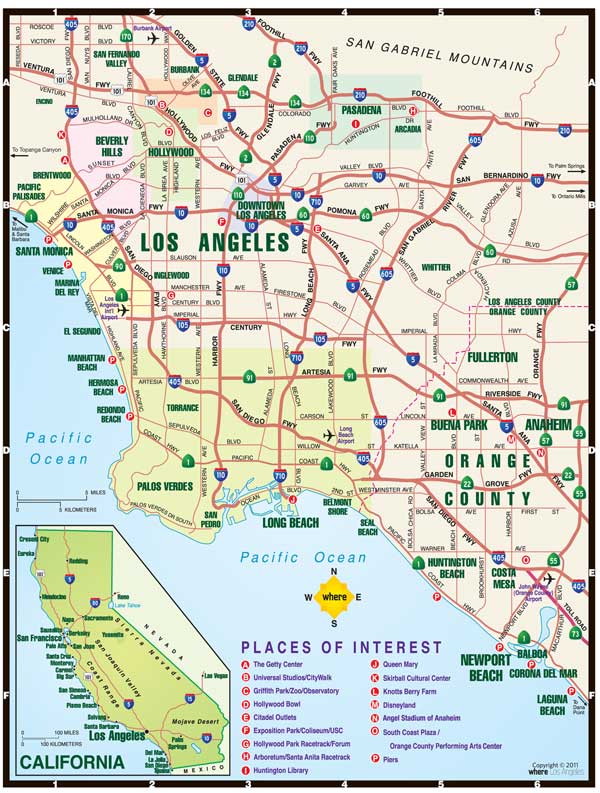
The city map of LA displays the layout of Los Angeles. Unlike the NYC map this map has places of interest located throughout the map. Major roads are shown as a bold red line. Smaller roads are a thin red line. The mountains and beaches are labeled. The airport is labeled on this map. This kind of map is helpful in figuring out something to do and getting there. Link: https://socalpulse.com/la/maps/la-map/.
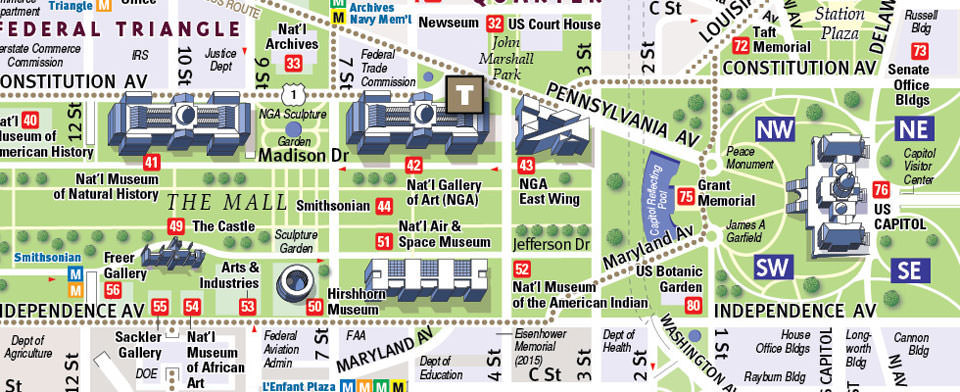
The city map of Washington D.C. displays the layout of the capital of the US. This map lays out the major building that make up the nation’s capital. Roads in this map are white. This map has 3D rendering of the buildings on Pennsylvania Ave. Many places of interest are located on this map. The map has compass. This kind of map is helpful for finding something to do. Link: https://vandam.com/mapstore_title.php?id=24.
6 Urban Transportation
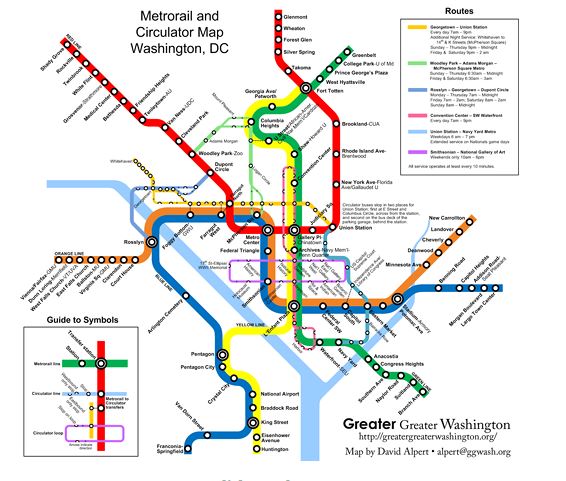
The urban transportation map of Washington D.C. shows the Metrorail system of Washington D.C. This map has many different color routes. Each route is colored by where they get out on. Each route has a stop and end point they go back and forth from. This kind of map is helpful for those who work in the area. Link: https://ggwash.org/view/6287/combine-the-circulator-and-metro-maps-for-visitors.
The urban transportation map of NYC shows the bus routes for Manhattan. Like the Washington D.C. map each route is colored based on its route. These bus routes have a designated start and end that they go back and forth from. This kind of map is helpful when comparing or mixing with the subway system of New York. Link: https://www.new-york-city-travel-tips.com/take-a-subway-or-bus-ride-in-new-york-with-the-metrocard/.
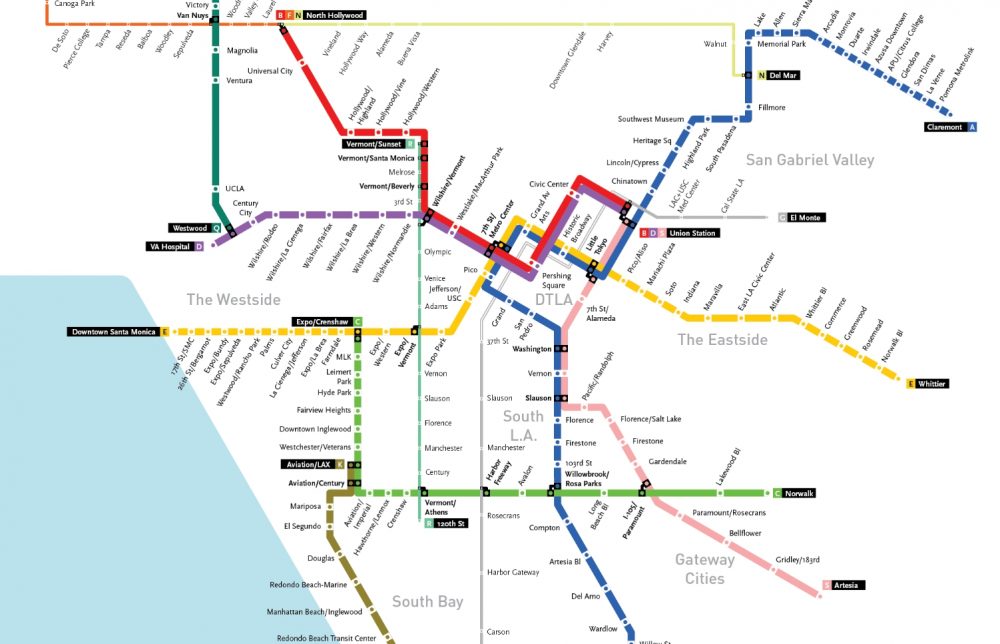
The urban transportation map of LA displays the ways to get around Los Angeles. Much like the Manhattan map this covers bus routes. A lot like the other maps the routes are separated on their start and stop locations. This public transportation set up is a lot more organized than the others. This kind of map is helpful for cheap travel. Link: https://www.lamag.com/citythinkblog/los-angeles-transit-2028-1926/.
7 Tourist Sites
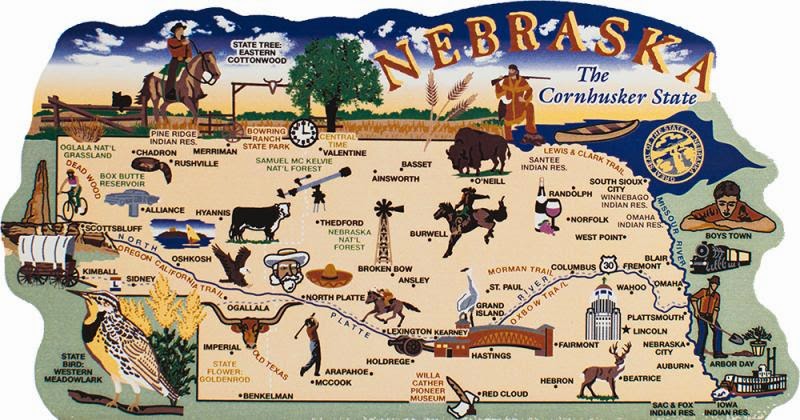
The tourist maps were some of the more fun maps to look at. The tourist maps are important features of a location or region. The Nebraska tourist map displays all the most well-known items there. I80 us a thin blue line across the state as it is important in getting anywhere. Beatrice is known for its deer on this map. Norfolk is known for wine in this image. Western Nebraska is known for cattle in this map. This kind of map is helpful with becoming familiar with a region. Link: https://www.tourist-destinations.com/2014/12/nebraska-usa.html.
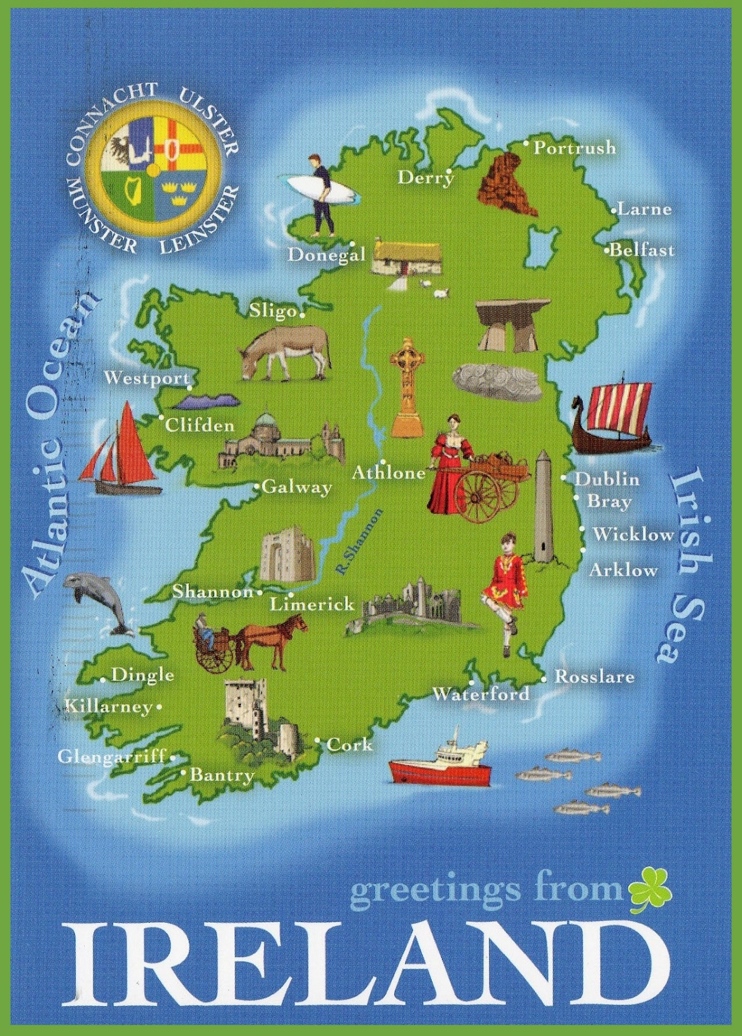
The tourist map of Ireland shows the iconic features of Ireland. Cork city is known for its castles. Dingle is familiar with dolphins. Donegal on the northern coast is a spot for surfing. Viking boats are frequently seen outside of Dublin. This kind of map is helpful when deciding where to go. Link: http://ontheworldmap.com/ireland/ireland-tourist-map.html.
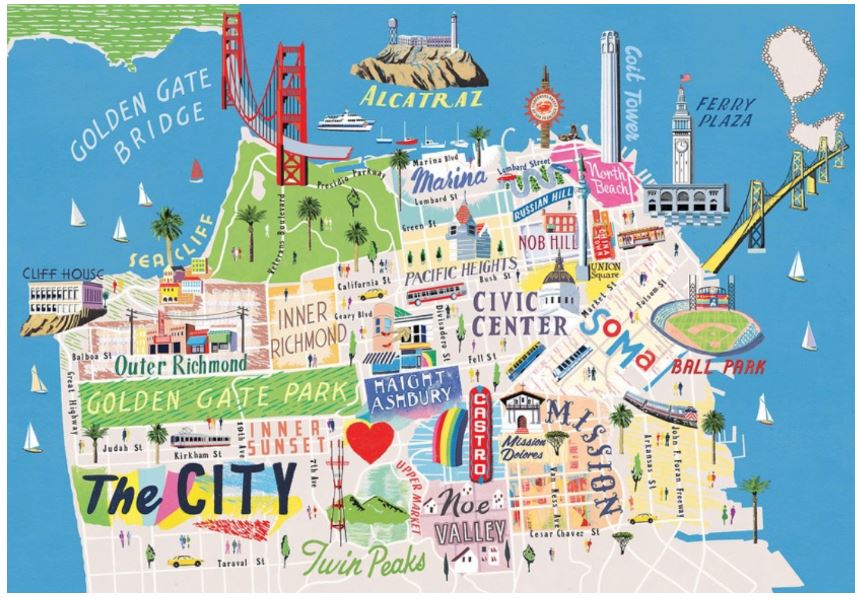
The tourist map of San Francisco displays the items that the city is most well known for. This map is very pretty and vibrant. This is my favorite map out of them all. These maps are best used for when trying to decide where to go because they show you almost all the location has to offer. The ballpark is on the east coast of San Fran. The city makes up much of the western portion of the city. The iconic bridge is in northern San Francisco. Alcatraz is just off the northern coast of the city. All in all, these maps all serve their own purpose and can be helpful in their own ways. Link: https://www.toreystreasures.com/2017/09/05/travel-guide-see-san-francisco-less-24-hours/.
Submitted by Matthew Shackelford on 3/6/20.